Codux Help Center
Browse our articles to find the answers you need
Editing Code in Codux
Codux, the state-of-the-art visual IDE for React that it is, merges the ability to render visual components in real-time with the utility of a code editor (which uses the same engine that drives Microsoft VS Code).
There are two methods of editing code in Codux: by opening a file through the built-in file explorer, or by altering project code via the code drawer. Since boards that you see in Codux are representations of their board code, when you make visual changes to a board, you'll see the code changes reflected in the code drawer right away (and vice versa).
Editing Code Through the Files panel
To edit the contents of your code files, select the Files icon at the bottom left of Codux, and then choose a file from the Files panel. The selected file opens as a new tab along the top of Codux.
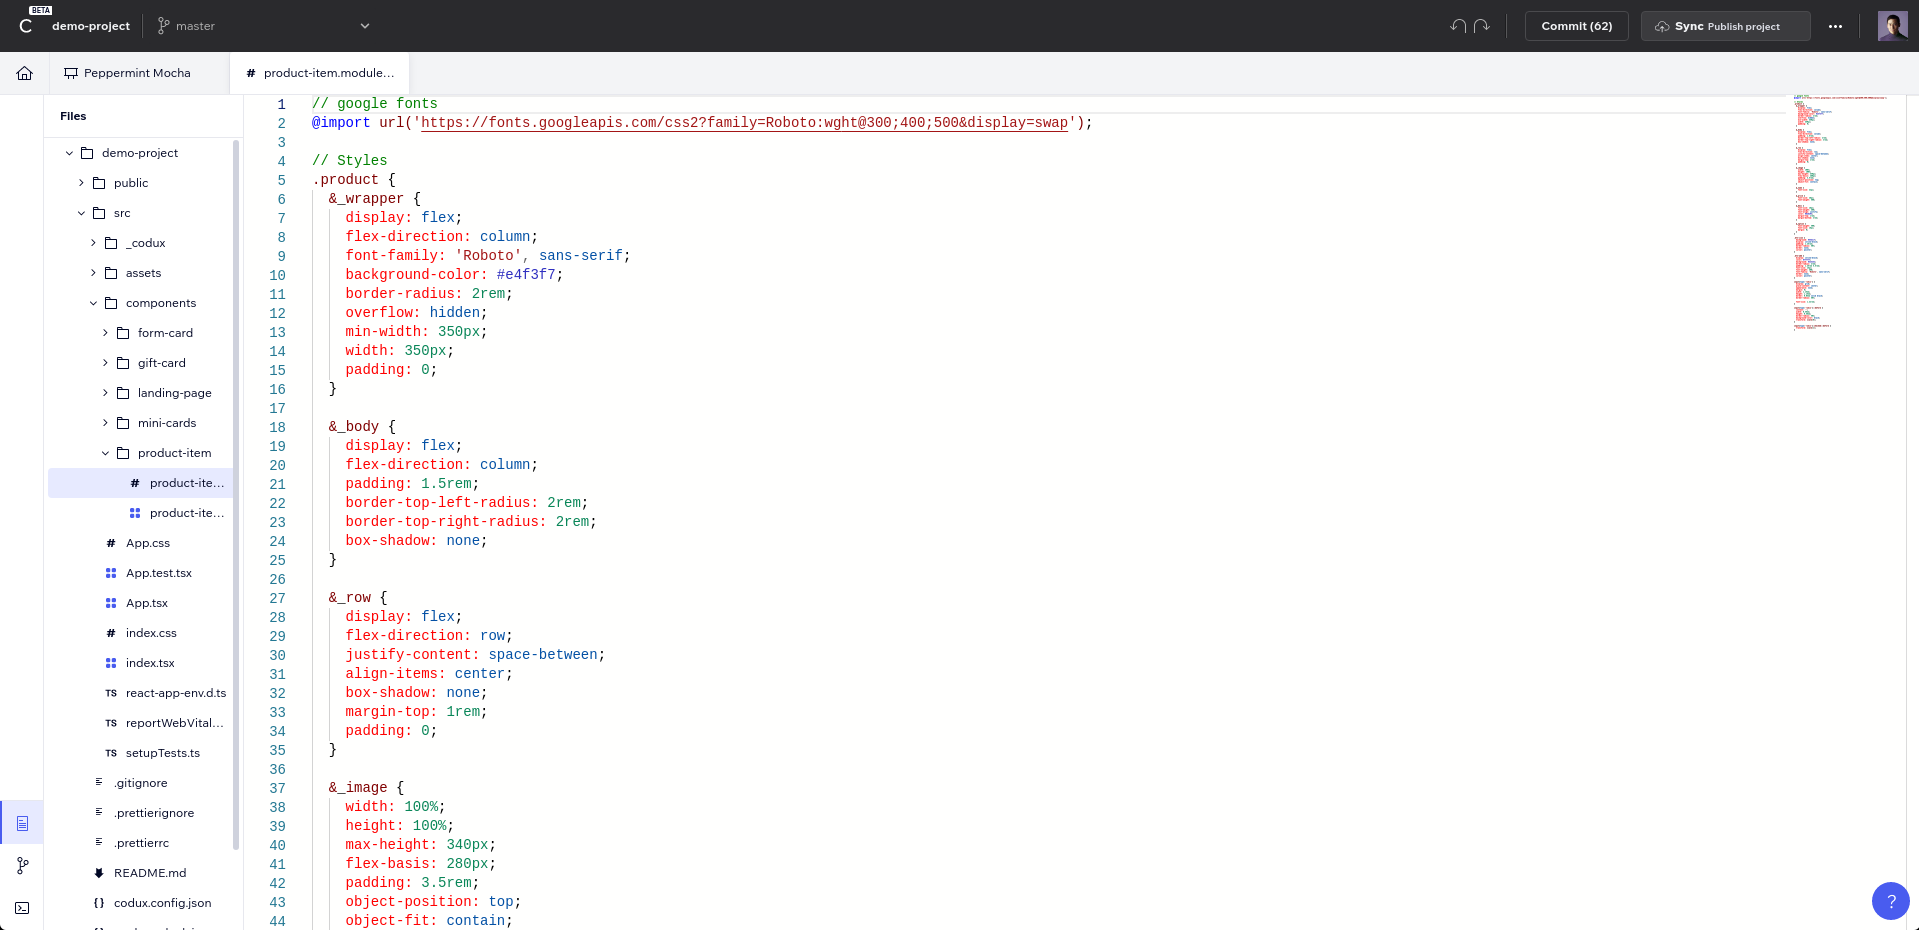
Changes you make save automatically. You can undo/redo changes using the undo/redo buttons at the top, or using the standard Ctrl + Z / Ctrl + Shift + Z / ⌘ + Z / ⌘ + ⇧ + Z keyboard shortcuts, and then use the built-in Git features to commit your changes and create pull requests to synchronize them with other project users.
Editing Code Alongside Boards
Open the code drawer at any time by dragging the code panel up, or using the expand buttons.
Tip!
There's also a keyboard shortcut to open the drawer – Ctrl + ⇧ + D for Windows machines, and ⌘ + ⇧ + D for Macs.
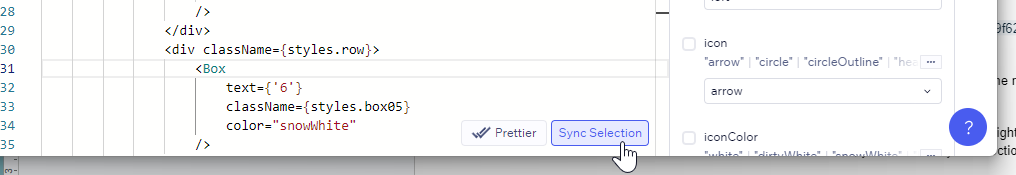
When the code drawer is open, Sync Selection automatically locates and highlights the relevant code blocks in the code drawer based on what's selected in the UI.
Note:
Sync Selection is enabled globally by default. If you no longer wish to see highlighted code in the code drawer relevant to what's selected in the UI, you can turn Sync Selection off with the button in the drawer.
To go directly to the code relevant to a particular property, select Edit Code beside that property in the Properties panel, or choose View Code from the Computed Styles and Styles panels.
Opening Additional Files Through Search
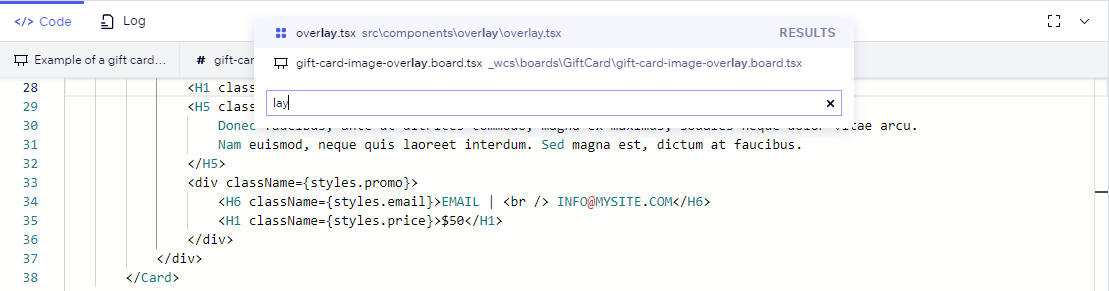
You can also search for and open any file from your project alongside the boards and component files already open. Click on the + icon and choose another file to open from the overlay menu that appears.
View Logs
In the code drawer is a Log tab, which displays the console output of your project. You can use the Log tab to debug your code and check for any errors, warnings, logs, or info messages.
Filtering Logs
The Log tab has a filter option that allows you to select which types of messages you want to see. You can choose to show or hide errors, warnings, logs, or info messages by toggling the relevant options.
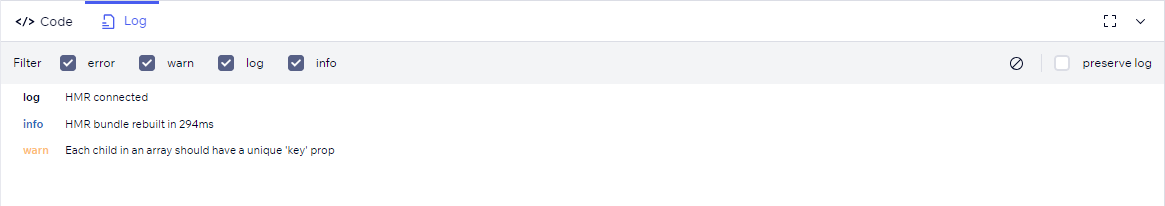
Click the ⊘ symbol to the right of the filters to remove all messages from the console and get a fresh start.
Was this article helpful?